一、二维箭头
1.调用annotation函数绘制二维箭头annotation函数用来在当前图形窗口建立注释对象(annotation对象),它的调用格式如下:
要注意这里的x,y坐标是specified in normalized figure units,其值必须在0~1之间
(1) annotation(annotation_type)  % 以指定的对象类型,使用默认属性值建立注释对象。
(2) annotation('line',x,y)       % 建立从(x(1), y(1))到(x(2), y(2))的线注释对象。
(3) annotation('arrow',x,y)      % 建立从(x(1), y(1))到(x(2), y(2))的箭头注释对象。
(4) annotation('doublearrow',x,y)% 建立从(x(1), y(1))到(x(2), y(2))的双箭头注释对象。
(5) annotation('textarrow',x,y)  % 建立从(x(1),y(1))到(x(2),y(2))的带文本框的箭头注释对象
(6) annotation('textbox',[x y w h])  % 建立文本框注释对象,左下角坐标(x,y),宽w,高h.
(7) annotation('ellipse',[x y w h])  % 建立椭圆形注释对象。
(8) annotation('rectangle',[x y w h])% 建立矩形注释对象。
(9) annotation(figure_handle,…)     % 在句柄值为figure_handle的图形窗口建立注释对象。
(10) annotation(…,'PropertyName',PropertyValue,…)  % 建立并设置注释对象的属性。
(11) anno_obj_handle = annotation(…)  % 返回注释对象的句柄值。
注意:annotation对象的父对象是figure对象,上面提到的坐标x,y是标准化的坐标,即整个图形窗口(figure对象)左下角为(0, 0),右上角为(1, 1)。宽度w和高度h也都是标准化的,其取值在[0, 1]之间。
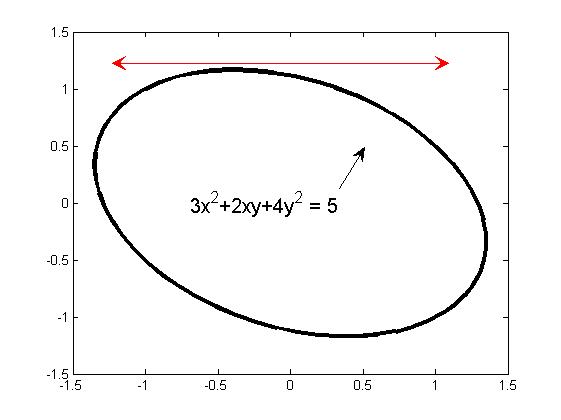
【例1】根据椭圆方程 绘制椭圆曲线,并修饰图形。
P = [3 1; 1 4];
r = 5;
[V, D] = eig(P);     % 求特征值,将椭圆化为标准方程
a = sqrt(r/D(1));     % 椭圆长半轴
b = sqrt(r/D(4));    % 椭圆短半轴
t = linspace(0, 2*pi, 60);    % 等间隔产生一个从0到2pi的包含60个元素的向量
xy = V*[a*cos(t); b*sin(t)];    % 根据椭圆的极坐标方程计算椭圆上点的坐标
plot(xy(1,:),xy(2,:), 'k', 'linewidth', 3);    % 绘制椭圆曲线,线宽为3,颜色为黑色
% 在当前图形窗口加入带箭头的文本标注框
h = annotation('textarrow',[0.606 0.65],[0.55 0.65]);
% 设置文本标注框中显示的字符串,并设字号为15
set(h, 'string','3x^2+2xy+4y^2 = 5', 'fontsize', 15);
annotation('doublearrow',[0.2 0.8],[0.85 0.85],'LineStyle','-','color',[1 0 0],'HeadStyle','cback3');
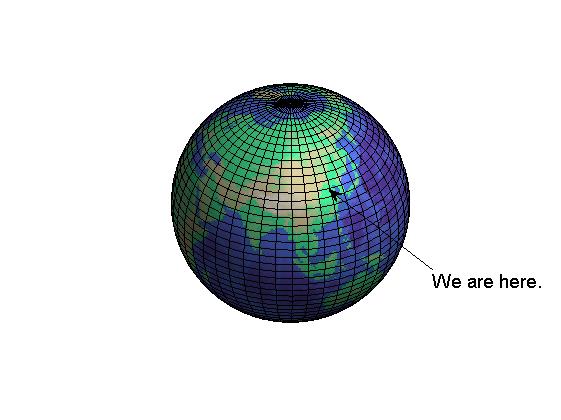
【例2】绘制地球仪,并标出我们的位置
% 绘制地球仪,并标出我们的位置
cla reset;
load topo;
[x y z] = sphere(45);
s = surface(x,y,z,'FaceColor','texturemap','CData',topo);
colormap(topomap1);
% Brighten the colormap for better annotation visibility:
brighten(.6)
% Create and arrange the camera and lighting for better visibility:
campos([1.3239  -14.4250  9.4954]);
camlight;
lighting gouraud;
axis off vis3d;
% Set the x- and y-coordinates of the textarrow object:
x = [0.7698 0.5851];
y = [0.3593 0.5492];
% Create the textarrow object:
txtar =  annotation('textarrow',x,y,'String','We are here.','FontSize',14);
2.调用quiver函数绘制箭头
quiver函数的调用格式如下:
quiver(x,y,u,v)
quiver(u,v)
quiver(...,scale)
quiver(...,LineSpec)
quiver(...,LineSpec,'filled')
quiver(axes_handle,...)
h = quiver(...)
参数说明略,这里仅举两例。
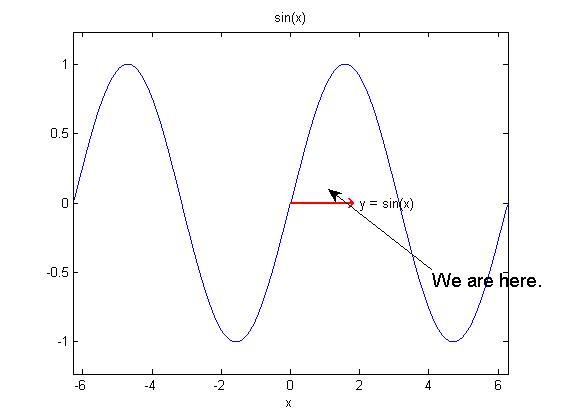
【例3】绘制正弦曲线,并修饰图形。
ezplot('sin(x)')
hold on
quiver(0,0,2,0,'r','filled','LineWidth',2);%注意其中的坐标(0,0)代表的是起点的x,y坐标,而后面的(2,0)并不是指终点坐标,而是坐标增量
text(2,0,'y = sin(x)')
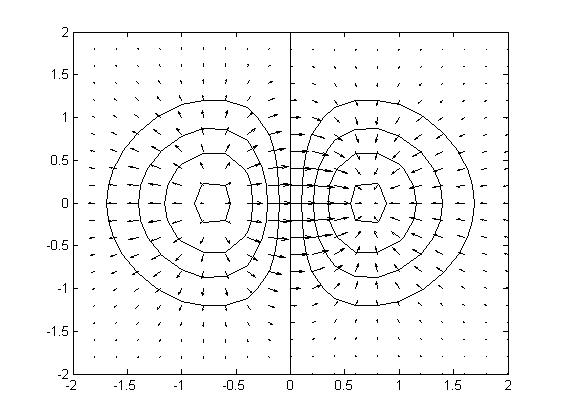
【例4】绘制三维曲面Z = x*exp(-(x^2+y^2)) 的等高线图和梯度场。
[X,Y] = meshgrid(-2:.2:2);        % 产生网格数据X和Y
Z = X.*exp(-X.^2 - Y.^2);         % 计算网格点处曲面上的Z值
[DX,DY] = gradient(Z,0.2,0.2);    % 计算曲面上各点处的梯度
contour(X,Y,Z) ;                  % 绘制等高线
hold on ;                         % 开启图形保持
quiver(X,Y,DX,DY) ;               % 绘制梯度场
h = get(gca,'Children');          % 获取当前axes对象的所有子对象的句柄
set(h, 'Color','k');              % 设置当前axes对象的所有子对象的颜色为黑色
3.调用text函数绘制箭头
通过设置图像窗口中文本对象属性也可绘制箭头,请看下例:
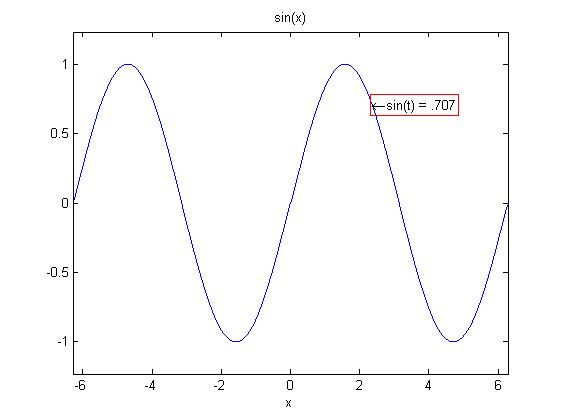
【例5】绘制正弦曲线,并修饰图形。
ezplot('sin(x)')
text(3*pi/4,sin(3*pi/4),'\leftarrowsin(t) = .707','EdgeColor','red');
二、三维箭头
1.调用quiver3函数绘制三维箭头
quiver3函数的调用格式如下:
quiver3(x,y,z,u,v,w)
quiver3(z,u,v,w)
quiver3(...,scale)
quiver3(...,LineSpec)
quiver3(...,LineSpec,'filled')
quiver3(axes_handle,...)
h = quiver3(...)
参数说明略,这里仅举两例。
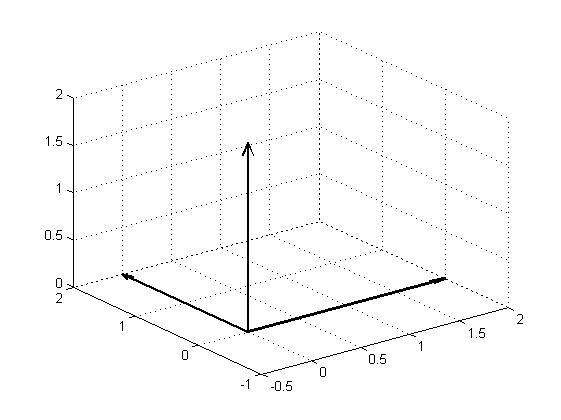
【例6】绘制三维坐标轴。
quiver3(0,0,0,1,0,0,2,'k','filled','LineWidth',2);
hold on
quiver3(0,0,0,0,1,0,2,'k','filled','LineWidth',2);
quiver3(0,0,0,0,0,1,2,'k','filled','LineWidth',2);
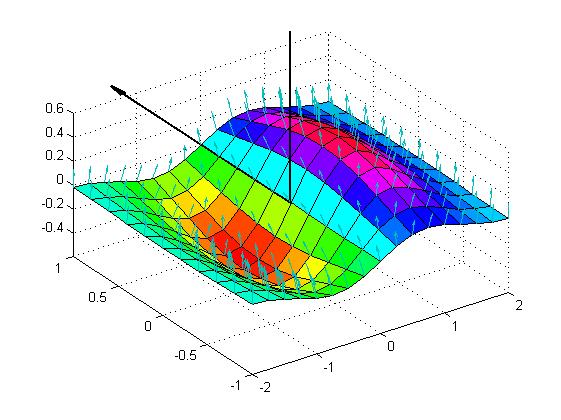
【例7】绘制三维曲面Z = x*exp(-(x^2+y^2)) 的法线向量。
[X,Y] = meshgrid(-2:0.25:2,-1:0.2:1);
Z = X.* exp(-X.^2 - Y.^2);
[U,V,W] = surfnorm(X,Y,Z);
quiver3(X,Y,Z,U,V,W,0.5);
hold on;
surf(X,Y,Z);
colormap hsv
view(-35,45)
axis ([-2 2 -1 1 -.6 .6])
hold off
quiver 改变箭头大小maxheadsize 缩放标记位置 scale
quiver(X(P2(i)),Y(P2(i)),-(X(P2(i))-X(P1(i))),-(Y(P2(i))-Y(P1(i))),0.5,'Color','k','LineWidth',2,'maxheadsize',1.1)
